Methods and Results
Summary.RmdMethods
TB case notifications from October 2013 to September 2023 (fiscal years 2014–2023) were collected from Khon Kaen Hospital’s medical records, covering both OPD and IPD data. The OPD and IPD data were combined for patients residing in sub-districts within Mueang Khon Kaen District each year. Duplicate patients were removed annually to determine the number of TB cases from 2014 to 2023.
In this study, we mapped the number of TB case notifications and their prevalence using the equal interval classification method. Spatial autocorrelation techniques, including Moran’s I and Local Indicators of Spatial Association (LISA), were applied to identify global and local clustering patterns.
Study area
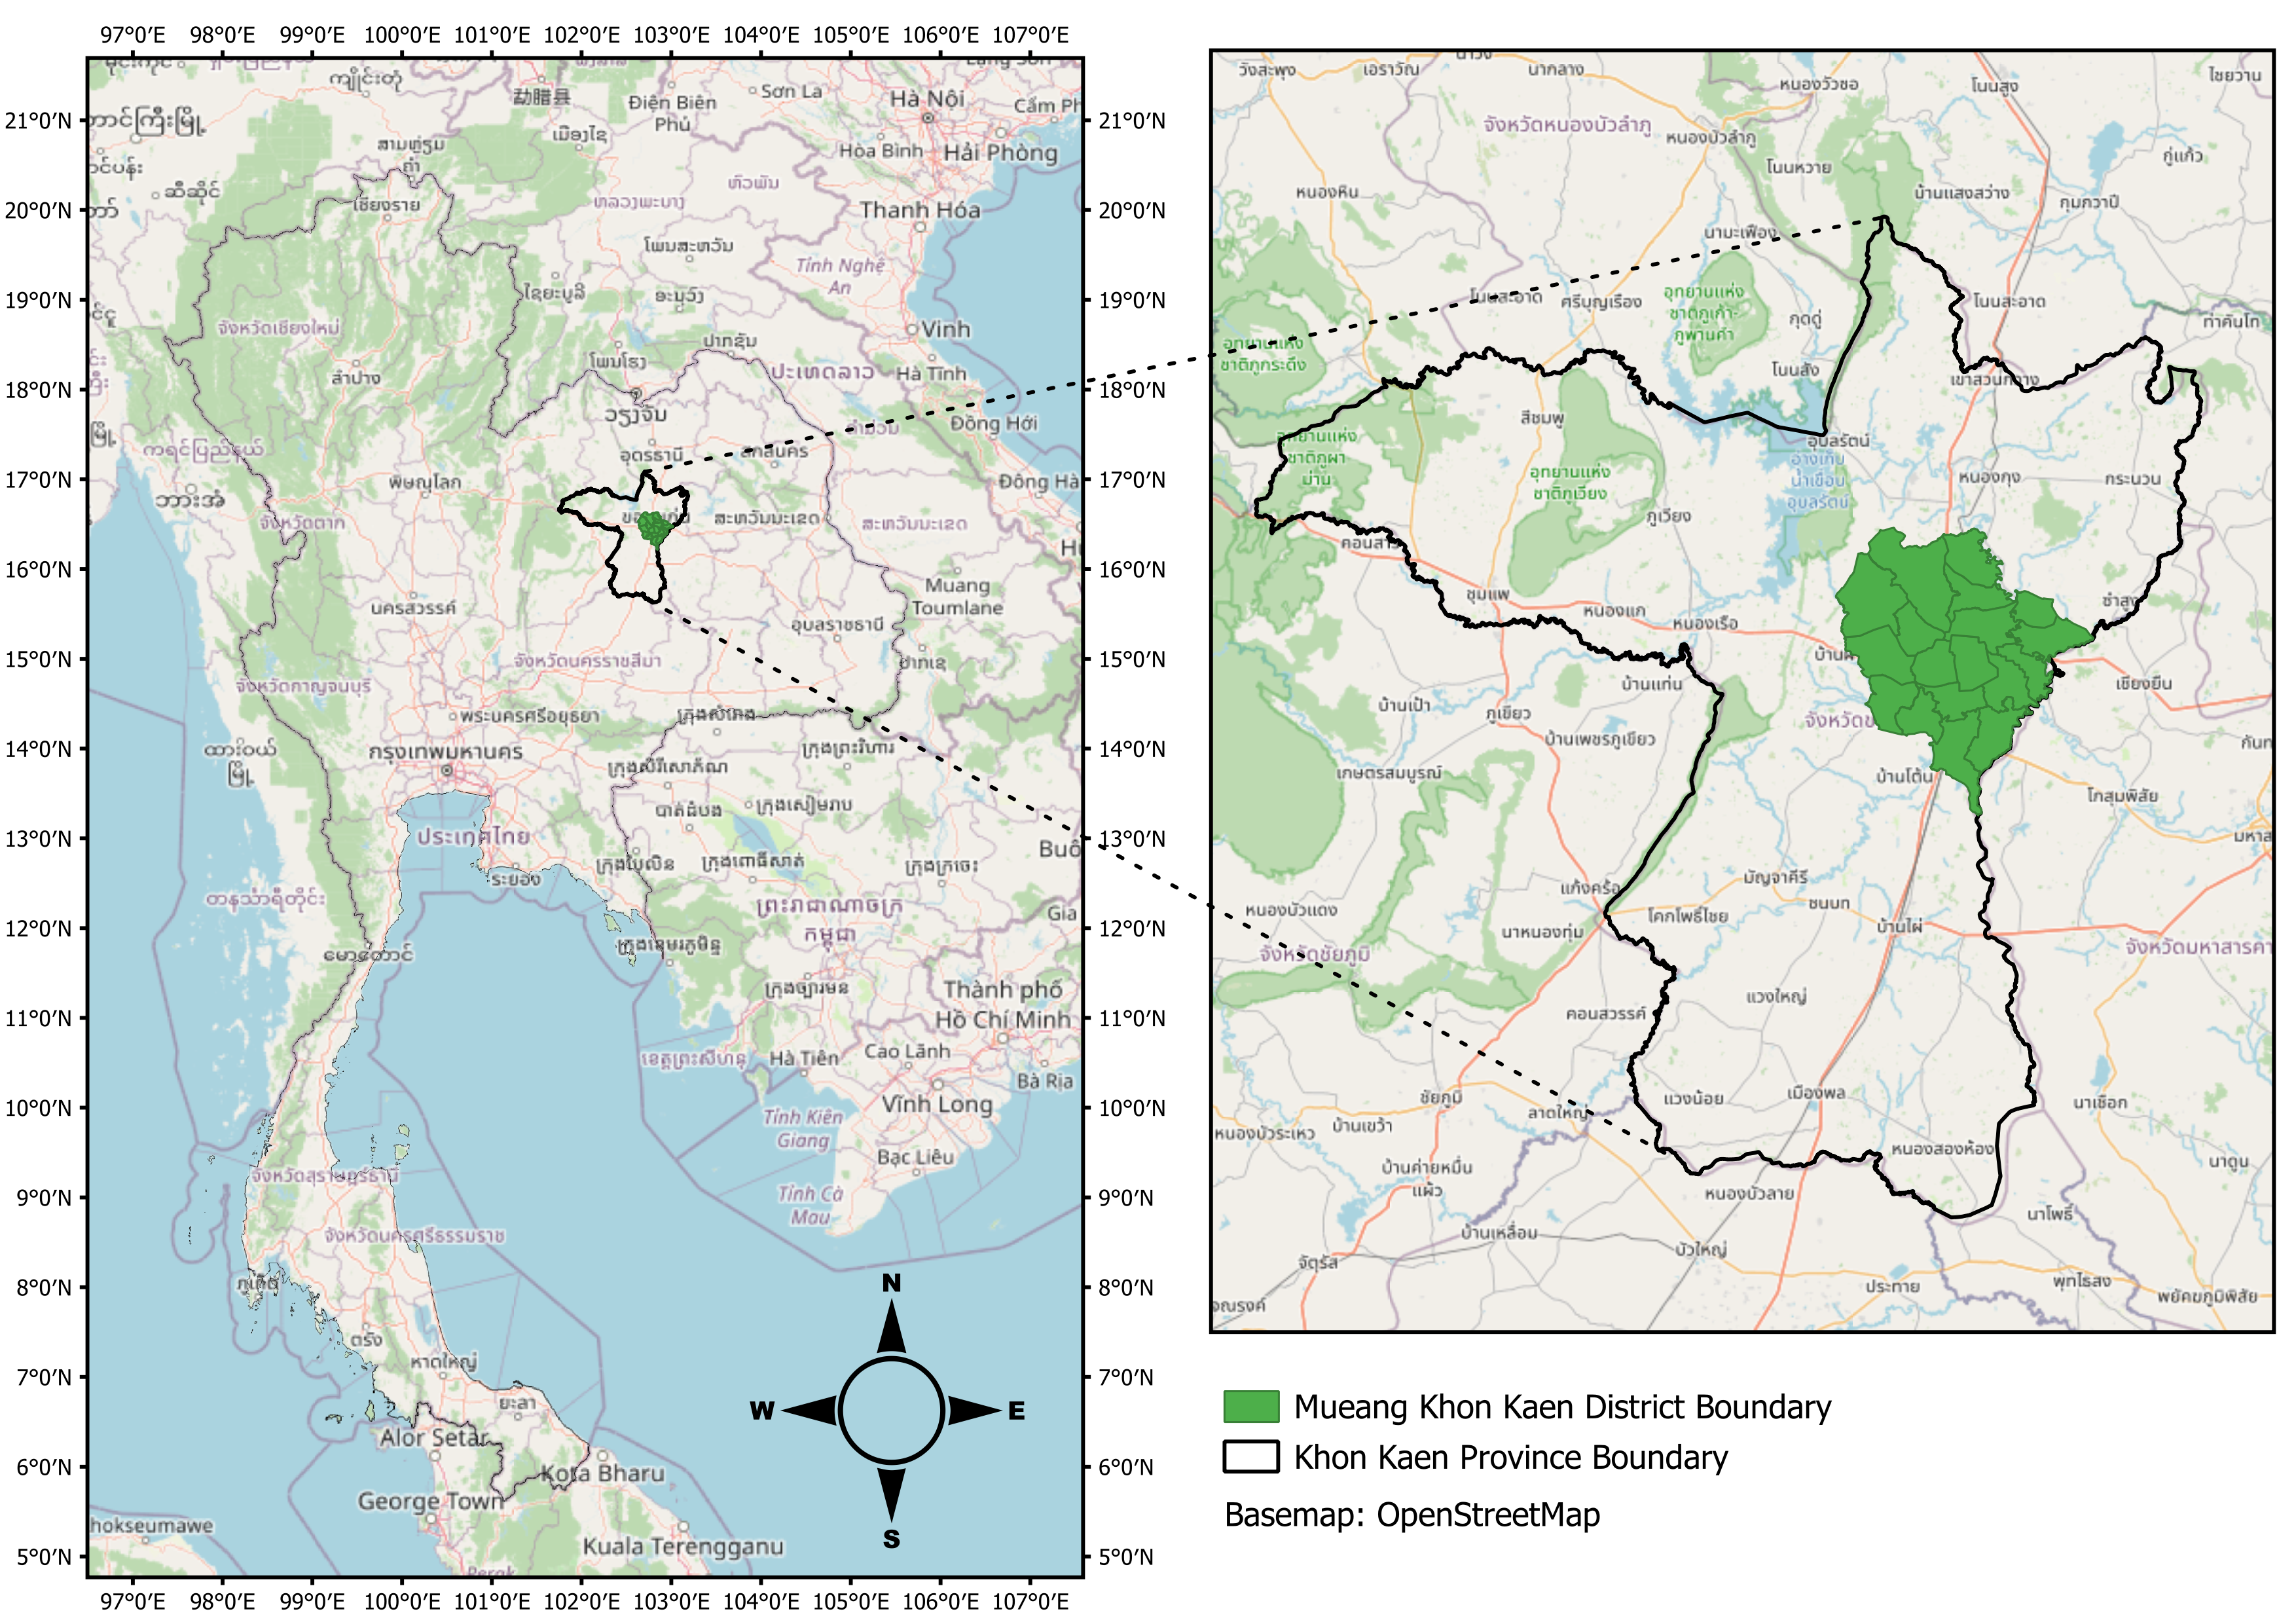
Khon Kaen is located in the central northeastern region of Thailand, with geographic coordinates approximately between 15°-17° North and 101°-103° East. It spans an area of 10,885.99 km², most of which comprises plateaus and low mountains. According to the Thai Meteorological Department, the climate in Khon Kaen is divided into three seasons: summer (mid-February to mid-May), the rainy season (mid-May to mid-October), and winter (mid-October to mid-February).
Mueang Khon Kaen District, the capital district, has the largest area in Khon Kaen and is located in the central part of the province at geographic coordinates around 16°26′ North and 102°50′ East, covering an area of 953.4 km².
Result
According to the data analysis, the descriptive analysis of tuberculosis (TB) case notifications is as follows:
Number of patients
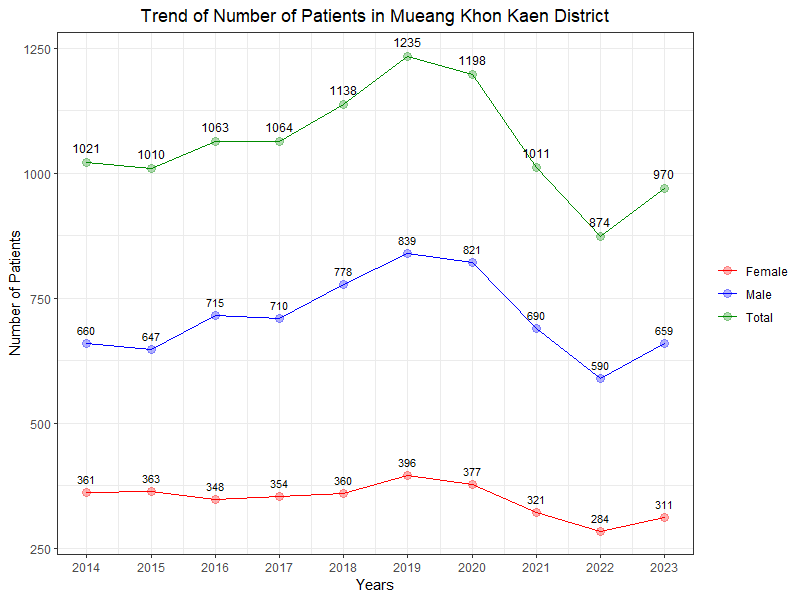
There were 10,584 TB patient notifications in Mueang Khon Kaen District from October 2013 to September 2023. By fiscal year, the trend peaked in 2019 with 1,235 cases and declined to its lowest point in 2022 with 874 cases. Regarding gender, the trend for male patients more closely resembled the overall trend compared to female patients, as presented below:
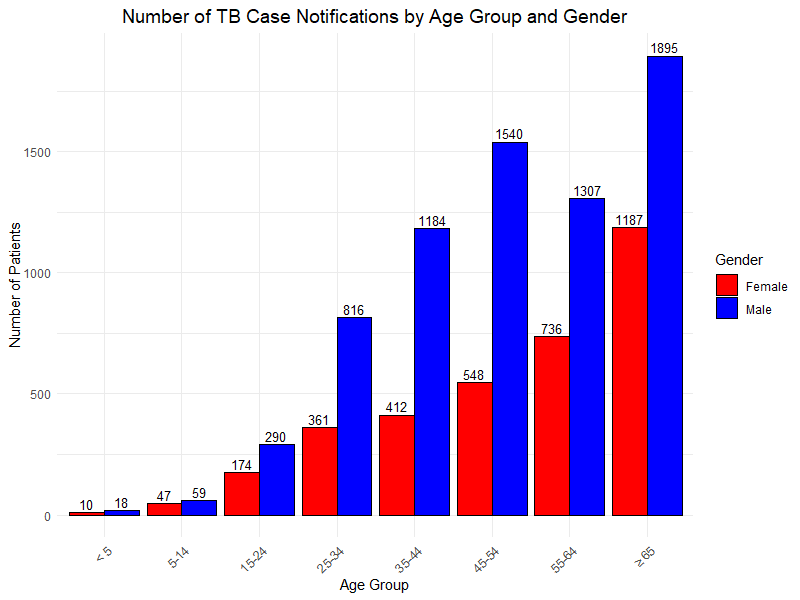
Regarding the age and gender distribution, male patients outnumbered females in every age group. The proportion of males to females was approximately 67% to 33%, with 7,109 male patients and 3,475 female patients. The highest number of TB case notifications was observed in the elderly age group (≥65), as shown below:
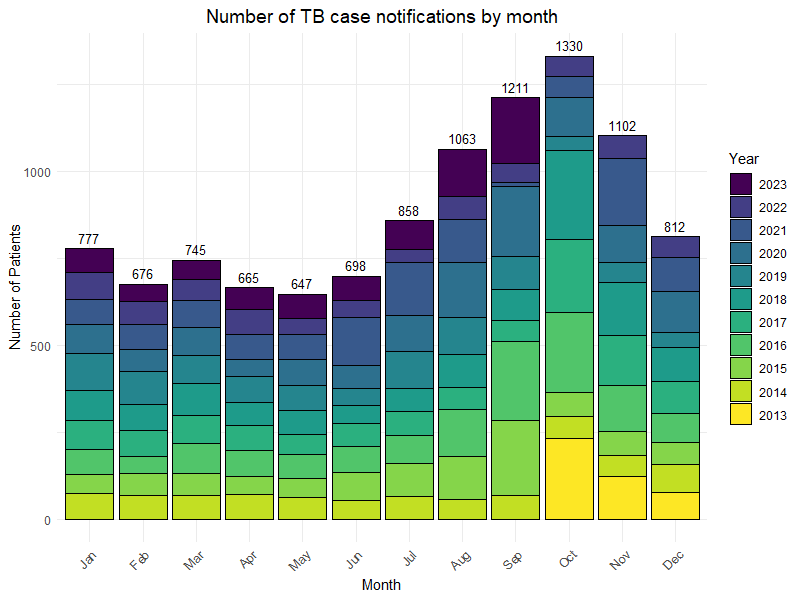
Seasonal pattern of tuberculosis case notifications
In Khon Kaen, the climate is divided into distinct seasons, as defined by the Thai Meteorological Department (TMD, 2020). This appears to influence the seasonal pattern of TB patient notifications. Peaks were observed during the winter months (mid-October to mid-February), while the lowest notifications occurred during the summer months (mid-February to mid-May).
Map of TB patient notifications
TB patient notifications were mapped using an equal interval break of 50 patients, with color palettes representing the number of TB patient notifications in each sub-district. The data were mapped by fiscal year. Most years demonstrated that patient notifications were concentrated in Nai Mueang and the surrounding sub-districts throughout the study period. See the Map of TB patient notifications for detailed visualization.
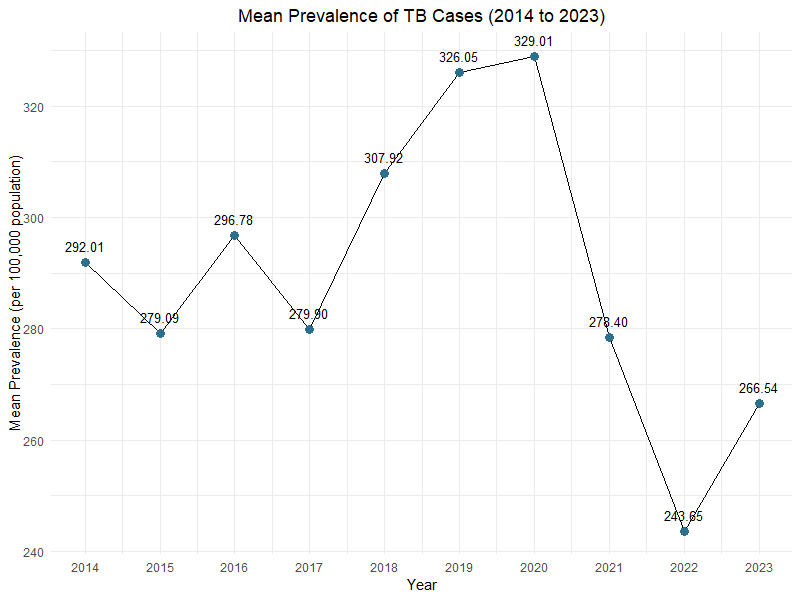
The mean prevalence of TB cases
The mean prevalence of TB cases during the study period (2014–2023) was 289.93 (SD = 87.42) per 100,000 population. Prevalence trends showed an increase from 2014, peaking in 2020 at 329.01 (SD = 99.83) per 100,000 population, before declining in 2022 to 243.65 (SD = 76.98) per 100,000 population. A slight increase was observed in 2023, as shown below:
During the study period, the Sub-district with the highest prevalence was Nong Tum, with a mean prevalence of 401.42 (SD = 63.87) per 100,000 population, while the lowest prevalence was observed in Don Han, with a mean prevalence of 166.62 (SD = 47.38) per 100,000 population. See the Tuberculosis Prevalence Map for detailed visualization.